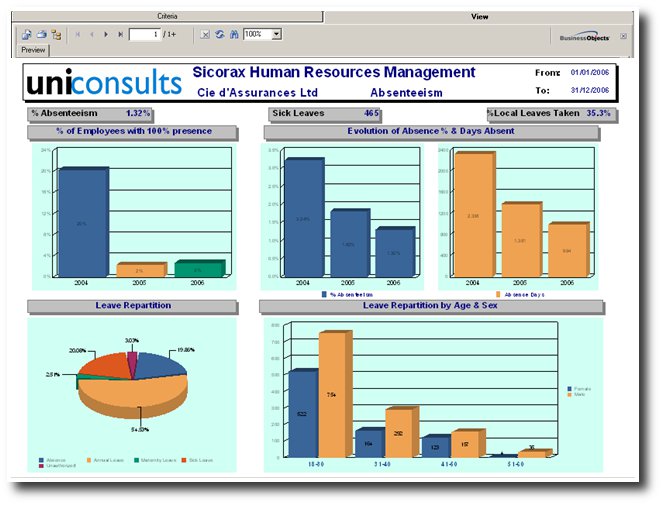
Leave Repartition by Age & Sex
- Leave Repartition by Age & Sex: Leaves analysis by age group and gender
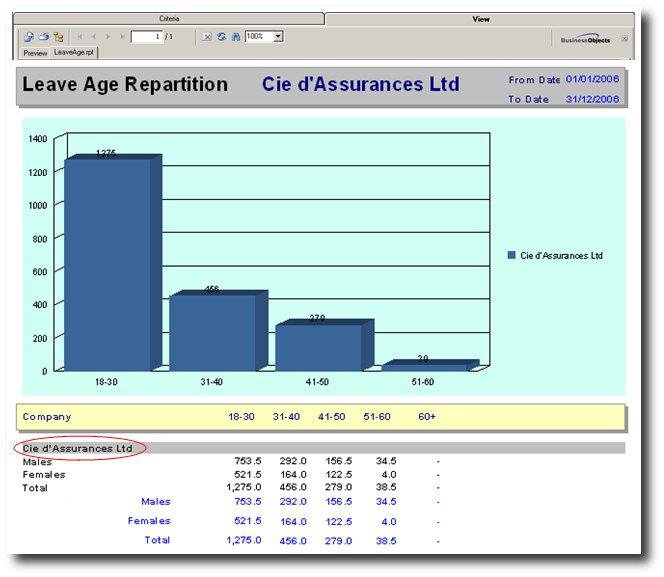
The bar chart illustrates the leave repartition by male and female employees within the different age groups
- Click on Leave Reparttion by Age & Sex button
- Click on the company's name to drilldown
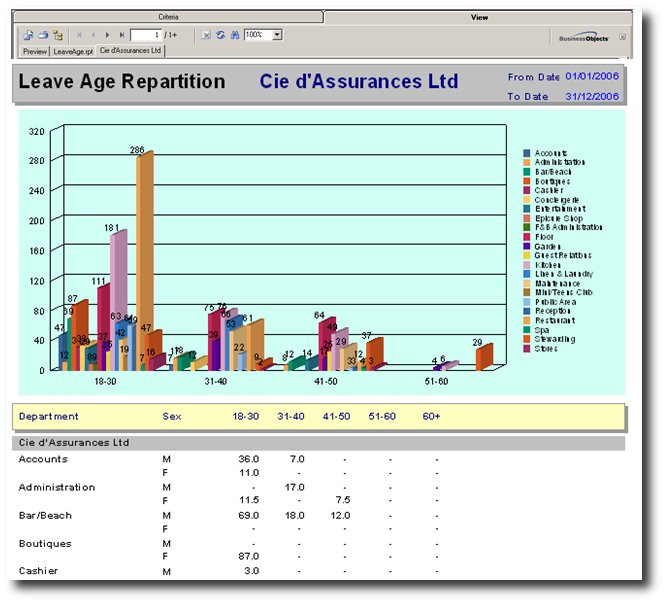
Here is the illustration by department
- Hints:
- Leave Repartition: From Date > = 01/01/2006, To Date < = 31/12/2006, Approved = True, Casual Employees = False


